
The results of measuring the distance and time of a body’s movement, as well as the speed, can be presented in tables or graphically.
In the first row, enter the symbol and the unit for the physical quantity. Data is entered in the appropriate columns.
Usually we have 2 columns.
See examples.
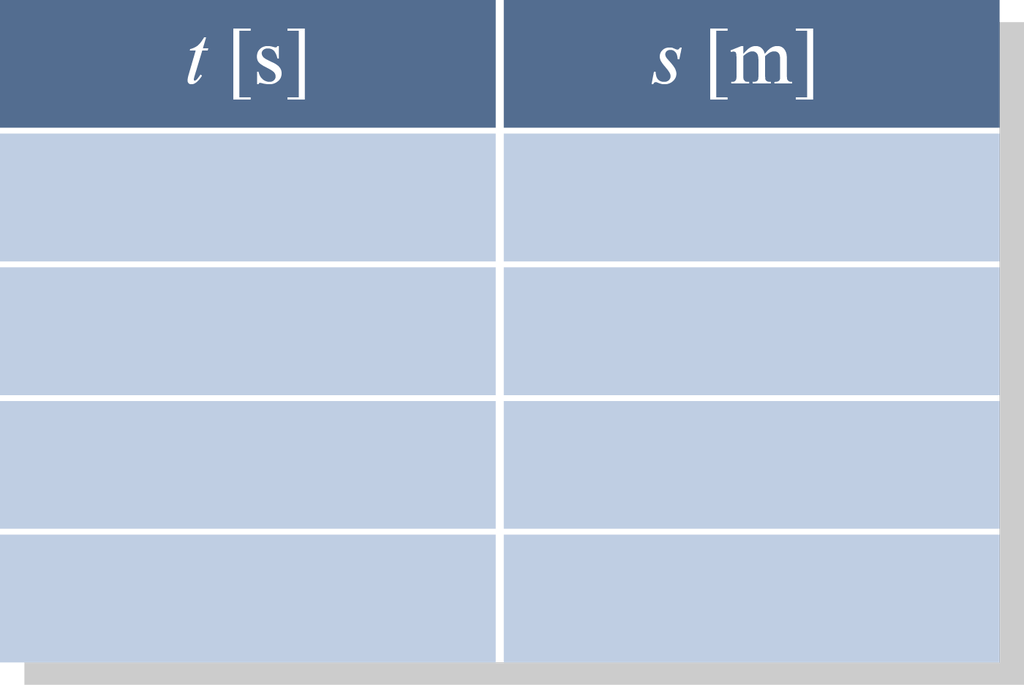
In the first column we enter the values for time t and in the second column the values for the distance travelled by object s at time t.
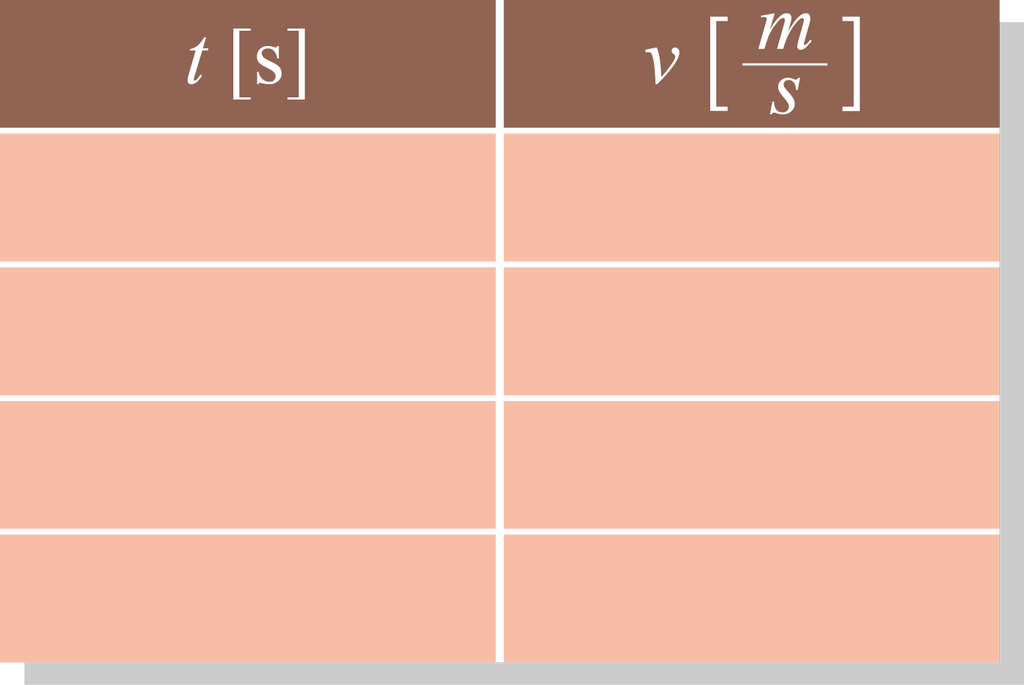
In the first column we enter the values of time t and in the second column the speed of the body v at a given time t.
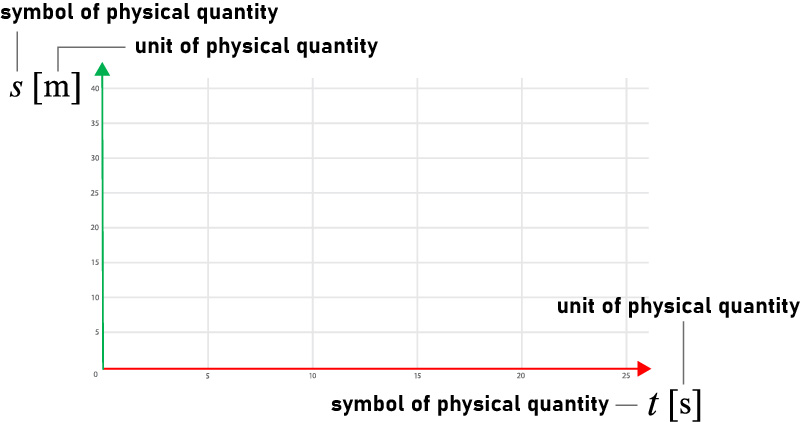
Draw the graph as follows:
Place the time (t) on the abscissa axis (coloured red). Add a unit (e.g. s or h) in the square brackets.
On the ordinate axis (coloured green) we refer to the distance travelled (s) or the speed (v).
Here again, we add a unit to the square brackets.
The line connecting the values is called a graph.
Watch the animation showing the formation of a graph for path and time for the uniform motion.
It can be seen that the graph distance versus time graph is a straight line.
The speed of the body can be determined by the slope of the line. The greater the slope of the line, the greater the speed of the body.
If we draw a graph of speed versus time for the same motion, we get a straight line. Speed does not change with time in uniform motion.
The path is directly proportional to the area of the figure bounded by the graph v(t). For the presented example, the path is equal to 2 m/s ⋅ 5 s = 10 m.
Watch another animation showing both graphs at the same time. How do the graphs change ?
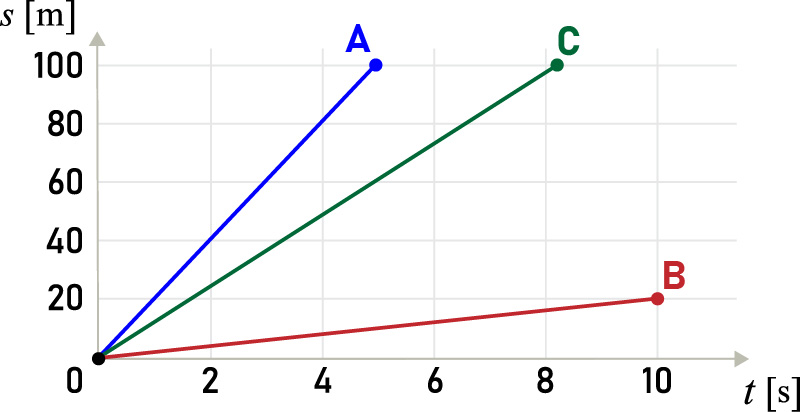
Look at the graph below, which shows the time and distance travelled by car A, B and C.
Which graph s(t) shows the motion with the highest speed?
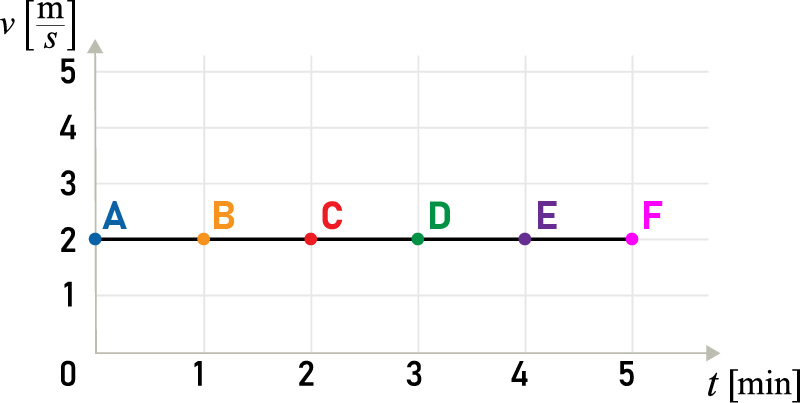
Look at the graph of speed versus time for a moving body. Take a good look at the axes of the graph and calculate the travelled distance.
Mark the correct answer:

2.5
When we observe moving bodies, we can see that their speed often changes.